
Appearance
How does Optimole count the number of visits?
Each visitor to your site is counted as a unique daily user, regardless of their actions (how many images they download or how many pages they visit) or how often they return on the same day. One exception applies: an unusually large number of image requests from the same source in a short time can add more than one visit. In practice this affects automated traffic such as scrapers, which request images far faster than a person browsing your site.
In this article
How can you check it?
You can access the analytics on the Optimole Dashboard, which displays the total number of visits. The Metrics page shows:
- A visits usage card with a progress bar comparing your current usage against your plan's visit limit, the remaining visits, and the exact dates of your current billing period.
- A visits chart with a per-website filter and a date range filter with the Last 30 days (default), Current Billing Month, Previous Billing Month, and Last Month presets, plus a Custom Range option that accepts any range of at least one week within the last 6 months.
- The total visits for the selected range, displayed below the chart, and an Export as CSV button that downloads the plotted per-day visit data.
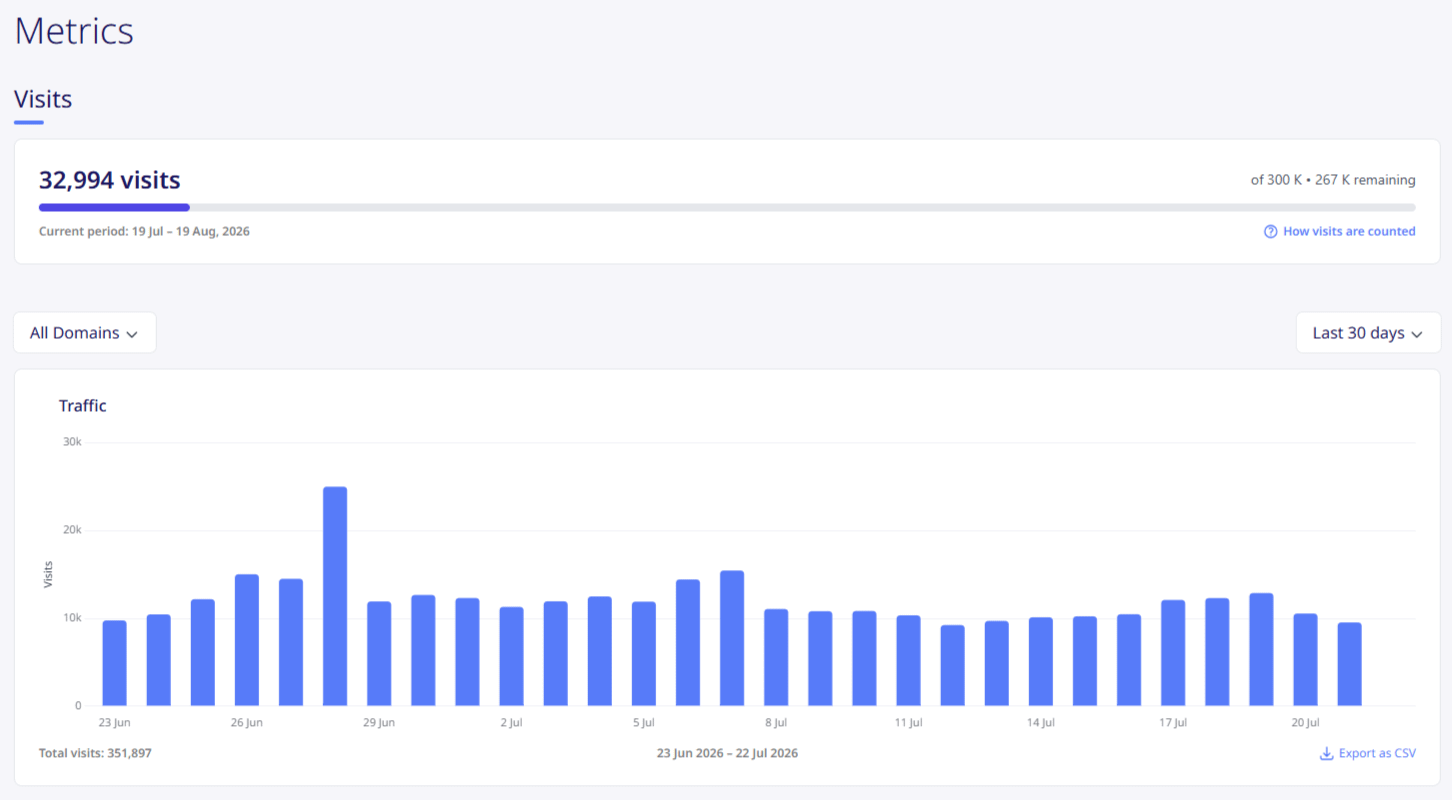
Always use the date range filter to select the period you want to review. The chart shows visits for the selected range only — the default Last 30 days view does not align with your billing cycle, so switch to Current Billing Month to check your quota usage, or to Previous Billing Month or a Custom Range to review earlier periods. When comparing usage across different periods, make sure the selected date range matches the timeframe you are investigating.
If you monitor the visits to your website with Google Analytics - data might be similar in some cases; however, the two tools measure traffic differently. Your server logs are useful for reviewing the traffic that reaches your site — count the unique IP + user data, and your hosting provider can guide you on how to find those — but they do not include requests made directly to Optimole image URLs, so they will not always match Optimole's total.
Our plans all have generous allowances for visits according to their tier.
- Free plans can optimize images for 2,000 monthly visits before needing a paid plan.
- Starter plan can optimize images for 48,000 monthly visits.
- Business plans can optimize images starting from 120,000 monthly visits.
📝 Note: Find out more about the pricing plans here.
Reading dashboard statistics after a quota email
If you receive a quota warning or plan-limit email and then check the dashboard but see a low visit count, the numbers are not necessarily wrong. The most common reasons for this apparent discrepancy are:
- Billing-cycle reset — Optimole's visit counter resets to zero at the start of each new billing period. If the reset occurred between when the quota email was sent and when you checked the dashboard, the current chart will show only visits from the new period.
- Date range mismatch — Make sure the selected date range matches the period the email refers to. If the quota email referred to a previous billing period that has since reset, switch the date range filter to Previous Billing Month, or use Custom Range to select the exact dates (any range of at least one week within the last 6 months). To investigate what caused a spike, review your hosting provider's server or CDN access logs (see the checklist below).
- Plan announcements vs. account changes — general product announcements (such as plan-limit updates) apply to all accounts and are not personalized notifications about your specific usage. Your individual plan limits remain as set on your subscription.
To verify the usage that triggered a quota email, open the Optimole Dashboard and use the date range filter to select the billing period covered by the email — Current Billing Month, Previous Billing Month, or a Custom Range covering the dates in question — then compare the numeric visit total shown. You can also use Export as CSV to download the per-day visit data for closer inspection. If the period in question is more than 6 months old, it is outside the range of the dashboard filters; your hosting provider's server or CDN access logs may still cover that period, though they only show the traffic that reached your site.
📝 Note: The numeric visit total shown in the dashboard is the authoritative figure for quota purposes — not the visual height of the chart bars. See Visits based plan for details on how automatic upgrades work when quota thresholds are reached.
Why per-site charts may look inconsistent
If you manage multiple websites under the same Optimole account, the visit charts for each site may appear visually inconsistent — one site's bars may look much taller or shorter than another's, even when the actual visit counts are similar.
This is because each per-site chart scales automatically to fit the traffic volume for that individual site. A bar that appears small on a high-traffic site may represent more visits than a tall bar on a low-traffic site.
Do not compare chart bar heights across sites. Instead, rely on the numeric visit totals displayed alongside the charts and use the date range filter to select the same period for each site when making comparisons.
When does my monthly quota reset?
Your visit quota resets on your account's subscription renewal date, not on the first day of the calendar month. For example, if your subscription renews on the 15th of the month, your quota resets on the 15th of each month.
To find your exact reset date:
- Log in to the Optimole Dashboard.
- Open the Metrics page — the visits usage card shows your current billing period dates (for example, "Current period: Jun 15 – Jul 14"). Your quota resets on the day after the period ends. Alternatively, check your renewal date in your account or subscription details.
If you cannot find your reset date, contact Optimole support and they can confirm the exact date for your account.
📝 Note: If you are approaching your monthly visit quota, see What happens if I exceed plan limits? to understand how Optimole handles overages and automatic upgrades.
What are the benefits of counting visits?
- Counting visits is a simpler way to show how Optimole uses its resources.
- Finding the right pricing plan is easier, and you won’t face any miscalculations.
- You can freely use more images and larger sizes without concerns about running out of optimization capacity or bandwidth. We believe this measurement will give you more confidence to make changes to your site without worrying about optimizations and bandwidth.
- There are no penalties for having visitors stay on your site for a longer duration.
- It’s clear and aligns with the other analytics you are tracking. Using Optimole usage statistics, we track the number of website visitors, which can help you track your usage as part of your site-wide tracking.
Why Optimole and Google Analytics numbers differ
It is normal for Optimole to report a higher visit count than Google Analytics. The two tools measure traffic in fundamentally different ways, and neither number is wrong — they capture different data.
Optimole uses server-side, CDN-level tracking. Every time an image is requested from the Optimole CDN, the request is logged using the visitor's IP address and user agent. A unique combination of IP + user agent within a 24-hour window normally counts as one visit; if that same combination makes an unusually large number of image requests in a short time, it can count as more than one. This happens at the server level, before the browser renders the page.
Google Analytics uses client-side JavaScript tracking. A visit is only recorded when the GA script loads and executes in the visitor's browser.
Because of this difference, Optimole counts traffic that Google Analytics misses:
- Bots, crawlers, and automated requests — including search-engine crawlers, LLM scrapers, uptime monitors, and other automated tools that request images but never execute JavaScript.
- Ad-blocker users — many ad blockers prevent Google Analytics from loading, so those visits are invisible to GA but still counted by Optimole.
- JavaScript-disabled browsers — visitors who disable JavaScript or use privacy-focused browsers are not tracked by GA.
- Partial page loads — visitors who leave before the page fully renders, or services that consume only images or partial content from your site (such as RSS readers, plugins, or APIs), are counted by Optimole but not by GA.
Optimole excludes known bots and crawlers from its count, including common crawler and link-preview agents such as Facebook's facebookexternalhit. However, unknown or new bots may still be included. Some automated traffic is harder to filter: bots that run a headless browser or spoof a real browser's user agent look like ordinary visitors at the CDN level, so Optimole cannot reliably distinguish them from genuine traffic and counts them. This kind of traffic is usually invisible to Google Analytics because it does not execute JavaScript, which is why a sudden spike can appear in Optimole while your Google Analytics numbers stay flat or decline.
📝 Note: Optimole's CDN-level visit count is the metric used for your plan quota and any automatic upgrades. Google Analytics data is not used for billing. Learn more about how quota upgrades work in Visits based plan.
Why some visits do not appear in your server logs
Because Optimole counts requests at the CDN level, an Optimole image URL can be requested on its own, without anyone loading a page on your site. Knowing which of the two paths a request took explains most large discrepancies:
- A normal page visit — a visitor opens a page on your site, their browser loads that page from your server, and it then requests the images from the Optimole CDN. The request appears in your hosting access logs and in Optimole's count.
- A direct image request — something requests an Optimole image URL on its own, because that URL was cached, embedded on another page, shared, hotlinked, or indexed. No page on your site is loaded, so your server never sees it. The request appears only in Optimole's count.
This is why a spike can be entirely genuine even when your own traffic looks flat.
What each log source can and cannot show
- Your hosting access logs show only the requests that reached your server. They cannot show requests sent straight to the Optimole CDN.
- Cloudflare, or another proxy in front of your site, shows only traffic routed through your domain. Requests to Optimole image URLs do not pass through it, so they never appear in Security > Events.
- The Optimole Dashboard is the only place that shows all of the requests Optimole counts.
⚠️ Important: Traffic that is missing from your server or Cloudflare logs is not evidence that Optimole is over-counting. In most cases it means the requests went directly to the image CDN and never touched your site.
Checklist for large or sudden discrepancies
If your Optimole visit count is significantly higher than Google Analytics, follow these steps to investigate:
1. Compare the same date range
Make sure you are comparing the same date range in both the Optimole Dashboard and Google Analytics. The chart defaults to the last 30 days, which does not align with your billing cycle — use the Current Billing Month, Previous Billing Month, or Custom Range filter to view the exact period you are comparing (up to 6 months back), and use Export as CSV to line up the per-day numbers against your analytics data.
2. Review your server or CDN access logs
Your hosting provider's access logs show the requests that reach your site, including bot and crawler traffic that Google Analytics does not capture. They do not include requests made directly to an Optimole image URL, so they can explain part of a spike but cannot fully account for the Optimole visit count. Look for:
- Repeated IP addresses making a large number of requests.
- Unusual user-agent strings (e.g., automated scrapers, AI crawlers, or monitoring tools).
- Sudden traffic spikes that do not correspond to real user activity.
Your hosting provider can help you locate and review these logs if you are unsure where to find them.
If your site is behind Cloudflare, you can investigate the traffic that reaches your site without server logs. Cloudflare sees requests to your own domain only, so direct requests to Optimole image URLs do not appear here either:
- Open Security > Events for the affected domain.
- Set the date range to match the Optimole spike.
- Filter or group the requests by IP address, user agent, ASN (the network the traffic comes from), country, and request path.
- Look for a concentration of requests from data-center or hosting networks, single-request visitors, or one country that does not match your real audience.
- Capture this evidence before you create any rules, so you can confirm the rules target only the abusive traffic.
If neither your server logs nor Cloudflare shows activity that matches the spike, the requests most likely went directly to the Optimole CDN. In that case, see When counted traffic cannot be blocked from your site below.
3. Identify bot or crawler traffic
Large discrepancies are often caused by automated traffic. Common sources include:
- Search-engine crawlers (Googlebot, Bingbot, etc.)
- AI/LLM scrapers and data-collection bots
- Uptime and performance monitoring services
- Hotlinking or content-scraping bots
If you identify specific IPs or user agents responsible for the spike, you can take steps to block them (see the next section).
Reducing unwanted counted traffic
These measures apply to traffic that passes through your site — for example, scrapers that crawl your pages and load the images from there. Where that is the source, blocking it at the edge can bring your counted visits down substantially.
If bots or automated requests are inflating your visit count, consider the following measures:
⚠️ Important: These measures apply to traffic that passes through your hosting server or your site's Cloudflare configuration. They cannot block a request made directly to an Optimole image URL, because that request never reaches your site. If your spike comes from direct requests to the Optimole CDN, these rules will not lower your visit count — contact Optimole support instead.
- Host or server-level firewall rules — most hosting providers allow you to block specific IP addresses or user agents from their control panel.
- Cloudflare Bot Management — if your site uses Cloudflare, enable its Bot Management or firewall rules to block known bad bots before they reach your site.
- Cloudflare Managed Challenge or custom rules — for browser-disguised bots that standard filters miss, create a custom rule that applies a Managed Challenge to traffic from the specific ASNs, countries, or paths you identified in the steps above. A challenge lets real visitors through while stopping most automated traffic.
- Rate limiting — apply a Cloudflare rate-limiting rule to pages or paths that the same sources are requesting repeatedly.
- WordPress security plugins — plugins such as Wordfence or Sucuri can help block suspicious traffic and limit bot access.
- Block abusive user agents — if your access logs reveal specific user-agent strings causing the spike, add rules to block them at the server or CDN level.
⚠️ Important: Apply blocking and challenge rules narrowly, and test them before leaving them on. Avoid broad measures such as Cloudflare's Bot Fight Mode or blanket country/ASN blocks unless you have confirmed the source — they can disrupt legitimate crawlers needed for SEO (such as Googlebot) as well as tools that connect to your site, such as import, backup, or uptime-monitoring services.
When counted traffic cannot be blocked from your site
If requests go straight to an Optimole image URL, they never pass through WordPress, your .htaccess file, your server firewall, or the Cloudflare configuration in front of your website. Rules in those layers cannot stop them.
Two things follow from this:
- Optimole does not currently offer hotlink protection or referrer-based blocking. A Cloudflare rule that blocks requests whose referrer is not your own domain applies only to your own site, so it does not affect requests made directly to Optimole-hosted images. Referrer-based blocking is also unreliable for image delivery, because legitimate requests from privacy-focused browsers, email clients, and social-media link previews often arrive with no referrer at all.
- Deactivating the Optimole plugin does not stop this traffic. Deactivating stops Optimole from replacing images on your site, but Optimole URLs that are already cached, embedded, shared, hotlinked, or indexed stay valid and can still be requested. Those requests can continue to count toward your quota.
If your visit count stays high and you cannot trace it to traffic passing through your site, contact Optimole support with the details listed below. Support can review the request data on Optimole's side, confirm whether the traffic is genuine, and help you find the plan that matches your actual usage.
When to contact support
If you have followed the steps above and the discrepancy remains unexplained, contact Optimole support with the following information:
- Your site URL.
- The exact dates of the spike you are asking about.
- The date range you are comparing in both Optimole and Google Analytics.
- An Export as CSV of the per-day visit data from the Metrics page for that range.
- Screenshots of the Optimole Dashboard and Google Analytics for the same period.
- Any access-log samples showing suspicious IPs or user agents, if the traffic reached your site.
- Whether your site uses Cloudflare, a proxy, or a caching layer.
- Whether you received a quota warning or automatic upgrade email, and the date it was sent.
Providing these details lets the support team compare your own records against Optimole's CDN-side data for the same dates.
📝 Note: For details on what happens when your plan limits are exceeded, see What happens if I exceed plan limits?.